Grocers' Differentiation Strategies are Evolving: Annual Report
(Editors' note: This is part three of a five-part series)
Sure, supermarket operators always want to differentiate from their rivals in any given geographical area — particularly in notoriously overstored regions like the Southeast — but the ways that they’re doing so are changing in tandem with shifting consumer needs.
Read the Rest of the Report
For instance, when Annual Report survey respondents were asked about the most influential department in driving their stores’ overall brand, image or point of differentiation, meat and produce actually tied at 21 percent each, perhaps reflective of consumers’ rising interest in eating greater amounts of fresh fruit and vegetables, while last year, meat was the clear front-runner, selected by 37.8 percent of respondents, with produce lagging behind at 12.2 percent. Deli/prepared foods, a well-publicized section of late, garnered 15 percent, down from 17.6 percent in 2017.
Next were the growing sector of private label, at 13 percent, up from last year’s 6.8 percent, and center store, at 11 percent, a precipitous decline from the 37.8 percent logged in 2017. Organic offerings, chosen by 8.1 percent of respondents last year, fell to just 2 percent this year, suggesting that with the wider accessibility of such products, shoppers are less likely to see them as a unique draw.
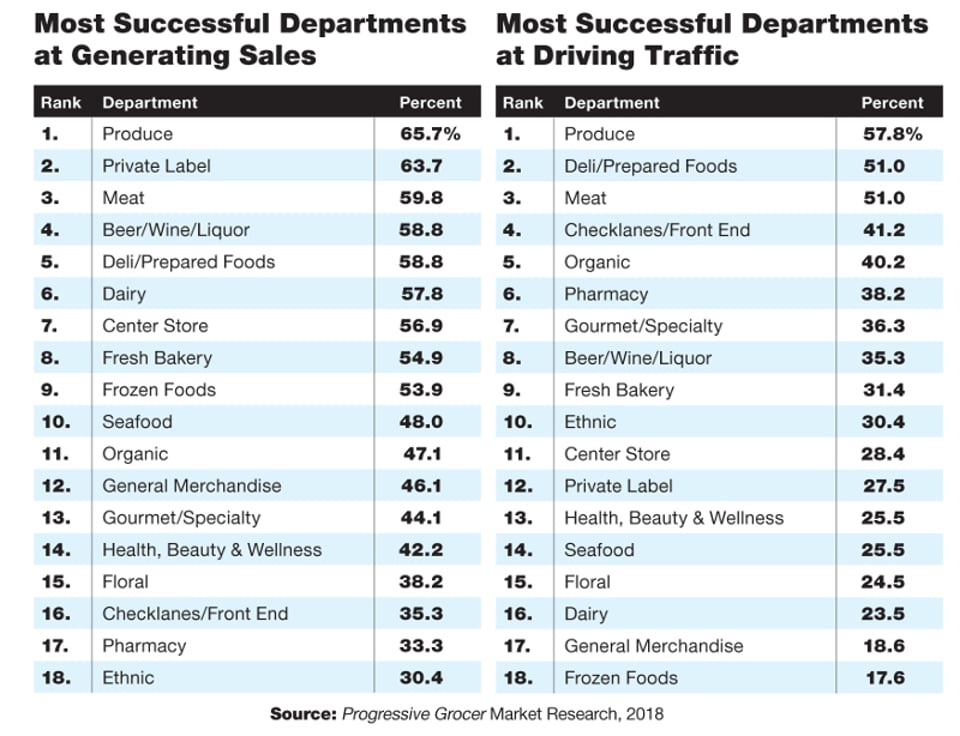
When it comes to generating sales, produce came in as the top department, displacing longtime champion meat, which dropped to third. Taking over the second spot was private label, moving up from last year’s fifth spot, while beer/wine/liquor held steady in fourth place and deli/prepared foods fell from second to fifth. Among the lower-ranked departments, seafood rocketed up five places from last year to land at No. 10, driven by consumers’ greater willingness to purchase and prepare fresh items found in that department.
For the departments driving the most traffic, produce also nabbed the top spot, switching places from last year with meat, which dipped to third place, while deli/prepared foods held on at No. 2. Rounding out the top five, checklanes/front end rose from seventh to fourth, while organic dropped a notch to fifth. Interestingly, pharmacy climbed six rungs from last year to capture sixth place, while fresh bakery, last year’s No. 6, fell to ninth. Also of interest: Ethnic products rose from 15th to 10th place, perhaps as consumers grow ever more comfortable preparing at home various cultures’ cuisines.
When asked about the merchandising/brand enhancement services that were most important to their companies, this year’s respondents overwhelmingly went for prepared foods, which a considerable 73.2 percent described as extremely/very important, a recovery of sorts from its fourth-place finish last year, but still below the 76.1 percent of respondents who deemed the category of paramount importance in 2016. Other crucial programs included signature products (72.6 percent), locally sourced products (67.9 percent), private label (65.5 percent), cross-merchandising (60.7 percent), and store-within-a-store specialty departments (54 percent). In common with last year, free WiFi (40.2 percent), in-store pharmacies (36.6 percent), BOGOs (33.9 percent), and cooking meal/prep stations (31 percent) were less popular options, although all but BOGOs upped their percentages from last year.
In the realm of customer interaction, meanwhile, community involvement continued to lead, with 73.2 percent rating it extremely or very important as a strategy. In common with last year, seasonal special events (59.8 percent) and sampling/demos (55.4 percent) maintained their second and third slots, although 2017’s No. 4, healthy store tours, was eclipsed by wellness events/counseling (31.3 percent) and health screenings (24.1 percent). The next-to-last rung was occupied this year by in-store restaurants (17 percent), while cooking classes again brought up the rear, this time at 9.8 percent.
For in-store services, on-site butchers (63.4 percent) — despite the shift to produce as a sales and traffic generator — and community programming (41.1 percent) once more topped the chart of extremely or very important strategies, while seafood specialists (31.3 percent) fell behind service-based kiosks, at 32.1 percent, as consumer-friendly currency conversion, deli/bakery-ordering and wine-tasting booths continue to infiltrate retail. Although relatively less used by survey respondents, such amenities as wellness experts (24.1 percent) and registered dietitians (17.9 percent) still outdid their 2017 percentages, indicating increased deployment in stores.


