Value-Added Meats Get Renewed Attention
One of the hottest segments of the fresh meat case is poised for even further growth in the years ahead, thanks to pandemic-induced cooking fatigue and consumers’ desire for more convenience and new flavors. Value-added meats – which include marinated cuts, pre-cubed proteins and other items that have at least one step of cooking preparation already completed – are getting renewed attention in the store and online as both retailers and suppliers ramp up their efforts in product innovation and merchandising.
“For the last seven years, value-added meats have been growing and have been one of the superstars of the meat case overall,” confirms Chris DuBois, SVP of the protein practice at market research firm IRI. “Beef in particular has had a tremendous run, but all across the board, we’re seeing year-over-year growth at about double the rate of the total meat case.”
For the grocers who have done value-added meat well – including Wegmans Food Markets, Publix Super Markets, Raley’s and many others – the payoffs have been undeniable, he says. “Our studies have shown that the retailers that get behind this and have strong value-added meat cases – meaning enough space, enough variety and a focus at the store level – grow faster than retailers that don’t have this, in their total meat case.”
Retailers that were already mastering their techniques are now doubling down on their efforts, with the latest evolution being cook-in-bag meals offered by grocers like Wegmans and Giant Food. Publix, which also offers such meals, is now showcasing value-added meats to account for nearly half of all the refrigerated meat at its new prototype store in Tampa, Fla.
In addition, a growing number of retailers that recognize this segment as part of a larger trend are choosing to feature value-added meats in meal solutions sections located in different parts of the store. ShopRite, for one, is highlighting prepped, ready-to-cook proteins in its Fresh to Table store-within-a-store concept, which has now been rolled out in at least five of its locations. The meats are merchandised alongside ready-to-heat and -serve items and ready-to-eat meals.
Inspired by a new class of global-minded flavors, the grocers with the most innovative value-added meat selections are typically those that do it on their own, according to DuBois. “In other words, they’re out there partnering with restaurants, trying new recipes, creating new smells inside their stores and finding new ways to make it a showpiece,” he explains, “and that’s what’s driving sales.” DuBois adds that plenty of smaller, independently owned grocers have excelled in this area, as they’ve gotten to intimately know the local culture of their neighborhoods and have sought out independently owned restaurants to come up with inspiration.
At the same time, meat suppliers are seeking out new partnerships to help grocers capitalize on the trend. Major players such as Tyson, Cargill and Smithfield are expanding their production capacity for value-added products, and smaller suppliers are getting in on the action, too, introducing new restaurant-inspired flavor profiles.
Indeed, for grocers that may be struggling with labor pains — meaning less workers and fewer hours — more manufacturers are coming in to save the day. “A lot of manufacturers now are working to figure out how to put central programs together for retailers,” says DuBois.
What’s Cooking at FreshDirect
In addition to their efforts in the store, many retailers are experimenting with how to best promote value-added fresh items online.
DuBois notes that it can be “tricky” to promote these products in the digital realm, mainly because it’s so much easier for customers to shop a varied meat case in person. However, the online channel presents a valuable demographic, he notes, because value-added meat tends to skew toward older couples without children – people who want to try something new or are looking for smaller portions – as well as younger couples who have a lot of disposable income. Both of those groups tend to gravitate toward shopping online.
New York-based FreshDirect, a pure-play online retailer owned by Ahold Delhaize, is promoting more value-added meats, including those it has developed in its own kitchens and new items from its vendor partners, according to Scott Crawford, FreshDirect’s chief merchandising officer.
Crawford explains that while the company’s merchandising team has always seen great traction on value-added items throughout its fresh departments, “we’ve seen a growing trend in the meat category specifically over the past couple of years, with an even deeper customer demand and merchandising focus.” He adds that he expects the trend to continue, and that FreshDirect plans to grow its share of value-added meats in the future.
According to Crawford, with unprecedented shifts to home cooking during the pandemic, value-added proteins “really solve a few pain points for our core customers – whether it be cooking fatigue, easy weeknight prep or protein angst, which is the intimidation factor of cooking at home.”
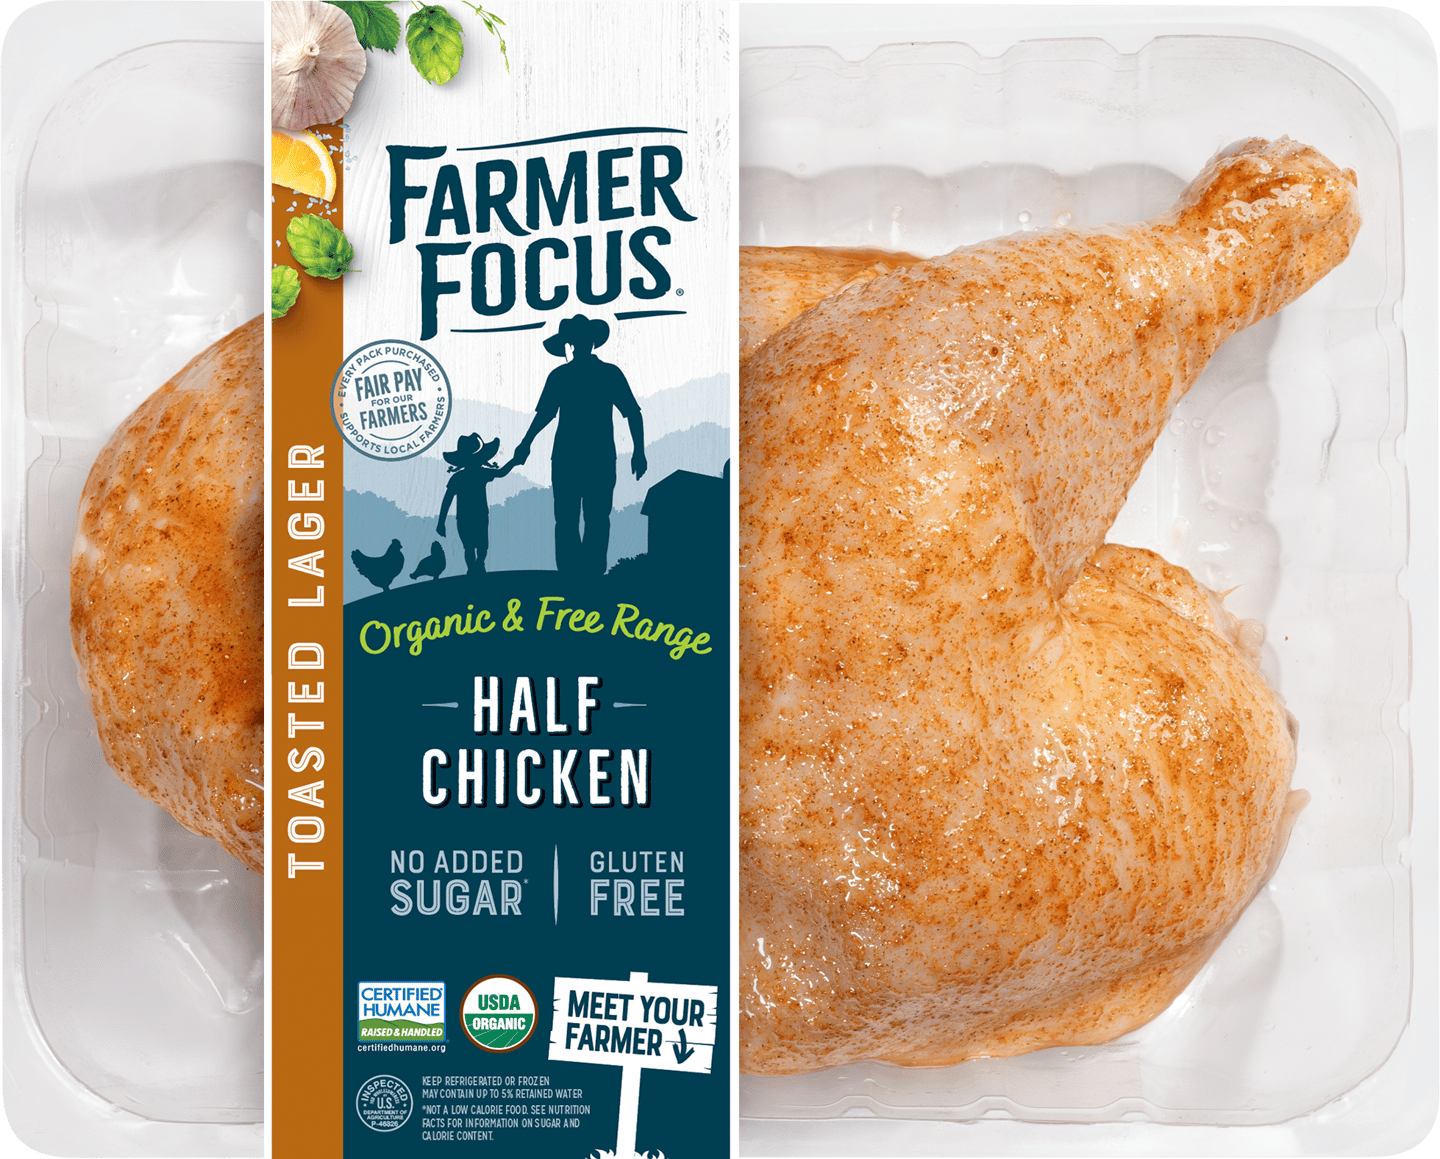
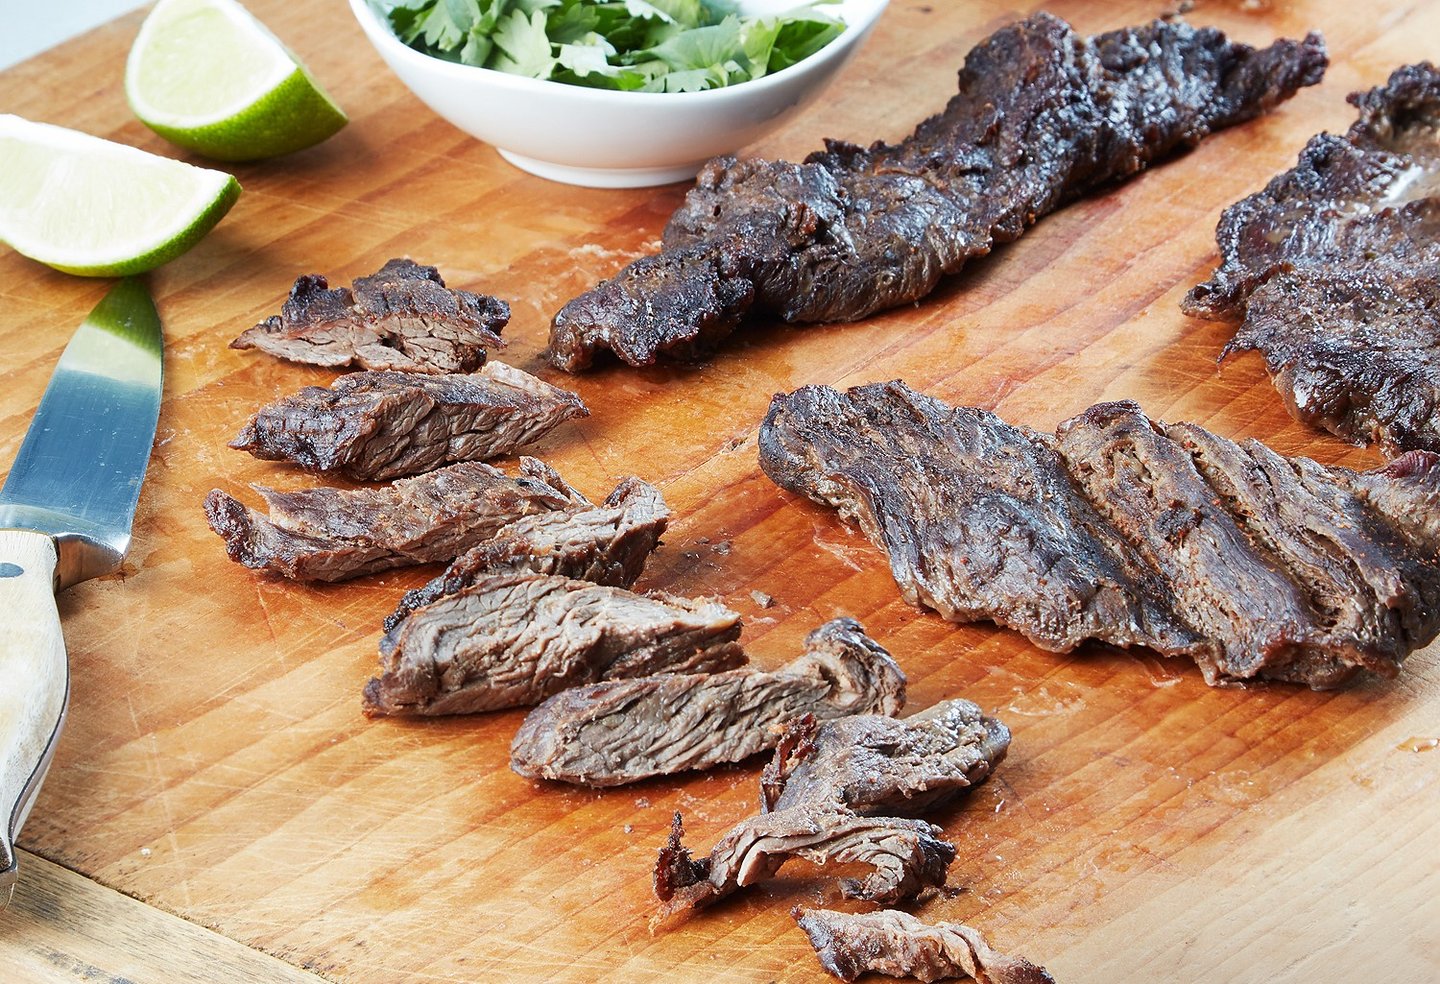
FreshDirect’s latest product offering includes such tantalizing recipes as Mediterranean Stuffed Branzino and Bourbon Marinated Flank Steak, all the way to a fully marinated half chicken.
The online grocer also recently featured a section on its website touting “New Ready-to-Cook Proteins,” noting, “We’ve added lots of tasty prepped and pre-marinated meats – consider them your secret weapon for easy weeknight meals.”
The section featured new pre-seasoned products from Farmer Focus, one of FreshDirect’s vendor partners that aligns with its values by offering high-quality organic and humane-certified chicken.
Harrisonburg, Va.-based Farmer Focus just launched its pre-seasoned, uncooked line in October, featuring Red Curry Chicken Thighs, Organic Toasted Lager Half Chicken, Organic Savory Chophouse Boneless Skinless Chicken Thighs, Organic Peruvian Boneless Skinless Chicken Breasts and Organic Lemon Pepper Boneless Skinless Chicken Breasts. Two of the items were recognized as NEXTY Award finalists.
Mark Saylor, senior brand manager at Farmer Focus, says that the line was crafted for health-minded shoppers, but also offers “adventurous and seasonal flavor profiles to help home cooks recreate restaurant experiences.”
While the company won’t comment on sales data, Ed Hinson, chief sales officer, says that Farmer Focus is seeing “solid early adoption across grocery, online retail and natural stores.” In preparation for more growth, the company is getting ready to open a new packaging facility.
Cross-Merchandising Opportunities
According to Hinson, Farmer Focus’s grocery partners have boosted their in-store sales by offering secondary displays and conducting promotions, in-store activation and digital campaigns. Value-added meats can present an ideal opportunity for cross-merchandising, he advises. “This can be executed through simple meal kit sections or more extravagant ways, such as wine pairing.”
Meanwhile, Farmer Focus has been able to help at least one retailer work around labor challenges. “We recently worked with a large natural chain to move from bulk supply behind a butcher case to pre-packaged, mid-store display, and the results have been very encouraging for both us and the retailer,” Hinson says.
As long as retailers and their meat suppliers continue to work together in such fashion, it seems likely that value-added meats will expand even more in years to come.
- Valuable Advice
Chris DuBois, SVP of the protein practice at market research firm IRI, has helped multiple retailers develop successful value-added meat offerings. He offers these three pieces of advice for grocers looking to build their in-store programs:
- Give value-added enough space: “Thirty feet is typically the rule of thumb,” DuBois notes. “You want to give it enough space so that shoppers can see alternatives and become interested in coming and trying it.”
- Create your own flavor town: “There’s a set of flavors that works well all across the country, with lemon pepper chicken being a great example,” observes DuBois. “If you can mix up the basics like that with some of the newer flavor varieties, that’s how you’ll bring people back. As long as you’re driving the innovation and creating some excitement, there’s always a reason for people to come back to the meat case.”
- Keep it local: Retailers that have excelled with value-added meats take strong command of their individual stores, paying close attention to local neighborhoods and what their shoppers like, according to DuBois, who says, “They’re partnering with restaurants and local chefs, weaving in cultural themes from their own locality.” While larger chains tend to have corporate initiatives or corporate-mandated items and displays in their fresh meat departments, it’s key that each store has the freedom to add flavors curated for the particular demographic that it serves, especially when it comes to value-added, he suggests.
Superstars of the Meat Case
Value-added meat sales have continued to grow at double the rate of the total meat case, according to the latest data from IRI.Product Type
Dollar Sales % Change vs. Year Ago
Volume Sales % Change vs. Year Ago
Fresh meat total
2.30%
-1.90%
Fresh meat value-added
5.80%
0.20%
Beef total
3.40%
-0.30%
Beef value-added
8.10%
4.10%
Pork total
-1.10%
-3.90%
Pork value-added
1.40%
-3.70%
Chicken total
1.20%
-2.80%
Chicken value-added
4.10%
-5.10%
Turkey total
-0.80%
-2.70%
Turkey value-added
3.50%
4.50%
Seafood total
13.50%
9.50%
Seafood value-added
14.80%
10.50%
Source: Data from IRI, from the latest 52 weeks ending Sept. 5, 2021


